 [Home]
In November and December 2012, the key to distinguishing robots was using Bid Histograms to determine which users consistently bid when precisely integer seconds remained on the auction clock, because this is humanly impossible as [explained here]. Since then, ArrowOutlet has changed all their robots' Bid Histograms.
In April, no users consistently bid when precisely integer seconds remain. But, there are still 949 users with nearly identical histograms when histograms should be very unique. And, this common histogram represents an unnatural bidding behavior which is possible for a human to achieve but no April humans bid that way. Therefore, you can still detect robots in April by looking at each user's Bid Histogram. (Bid Histograms were explained [here].)
The four Bid Histograms below show how ArrowOutlet changed the behavior of their robots and webpage's Bid-O-Matic.
| December robot | April robot |
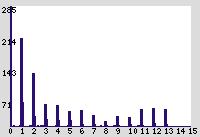 |
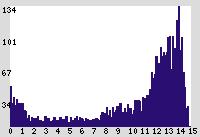 |
| December Bid-O-Matic | April Bid-O-Matic |
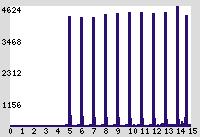 |
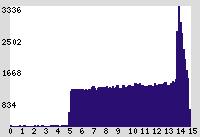 |
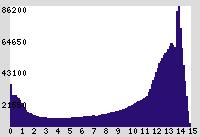
The next two Bid Histograms show the unnatural bidding behavior of April robots. Notice the following two features. (1) When robots bid at the last moment, they average a bid placed at 0 seconds remaining while humans average a bid placed at 1 second remaining. (2) Even though robots place 6 times as many bids as humans, robots never use the Bid-O-Matic feature while humans frequently use it. This is demonstrated by the absence of a sharp rise in the Histogram around 5 seconds.
| April average robot behavior | April average human behavior |
 |
 |
By superimposing the April average robot behavior over each April users' Histogram as a red outline, you can determine which April users are robots by the similarity of their Bid Histogram to the red outline. Click [here] to see all April Users' Bid Histograms with superimposed red outlines.
Additionally, you can use a second method called Activity Matrices to detect robots in April. This method worked in November and December, but we didn't publish it. Activity Matrices are explained [here]. Click [here] to see all April Users' Activity Matrices and Bid Histograms.
